
Yesterday in Part I of this series I discussed the three major SEO reports within Google Analytics—Queries, Geographical Data, and Landing Pages. When you sign into Google Analytics, these are the three reports that you’ll actually find under the Search Engine Optimization section, so you should master these reports first to help improve your SEO efforts.
Once you’re ready to get more advanced with your Google Analytics data, you’ll find that there are other reports that you can use to help your SEO that are under different categories. They might be designed to help you with other online marketing plans as well, but if you know how to interpret the data right and get creative, you’ll find that there is a lot of help out there for SEO than what is advertised.
Google Analytics Reports to Help You Improve Your SEO
To be clear, the list below aren’t necessarily reports like were covered in Part I, but more like Google Analytics features that can be used to help your SEO efforts. Either way, using these features will give you new data to work with, so you can think of them as reports in a sense.
And so without further ado, below are different options you can find in your Google Analytics to help you get a well-rounded picture of your SEO:
-
Linked-to 404 Pages Report.
This is an actual report that is incredibly easy to run. All you have to do is visit this link for the custom report, select your domain, and wait for the results. The report will show you an overview of all the 404 error pages that are on your site.
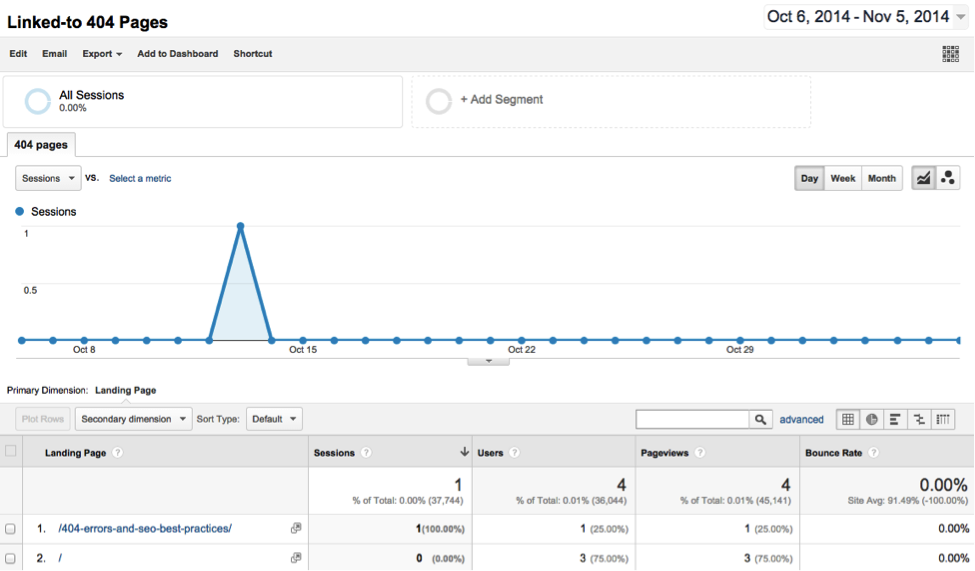
How to use this report for SEO: As you might imagine, 404 error pages are not great for your SEO. Use this report to click on the 404 page and see the full referral of the site that links to the 404 page. This will then help you find the links that need to be 301 redirected to a page that isn’t providing an error.
Where to find this report: Visit the link mentioned above and you’re set!
-
Content Experiments.
This feature from Google Analytics helps you to test up to 10 full versions of a single page on your website, so it’s a little bit more advanced than simply A/B testing. If you want to get technical, this is called an A/B/N model of testing pages. Below are a few things you can do with content experiments:
- Use a random sample of users and compare different pages’ performance.
- Determine the percentage of users you want to include in the experiment.
- Choose the objective you want to test—headlines, headers, images, text, CTAs, page layouts and designs, etc.
This feature will then send you information about how your experiment is doing. I also highly recommend using Goals in Google Analytics to work with your content experiments, which you can learn more about on the Google Support page here.
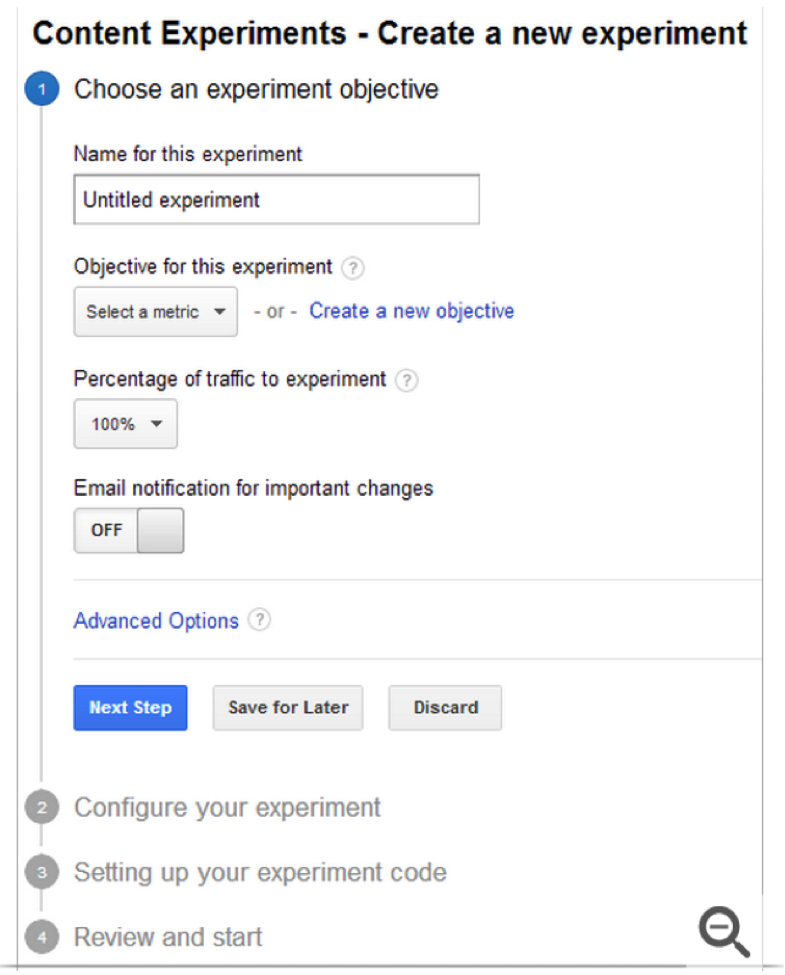
How to use the feature for SEO: Use the data that you gather from your landing page report (discussed in Part I) and then start experimenting! This will give you good starting pages to start analyzing. Setup experiments with different content or a different design and then see what works best. This should improve your CTR and SEO all at once. Learn more here.
How to find the feature: Go to your Behavior category and then click Experiments. You can then click Start Experimenting. This is just one click away from your regular diagnosis reports.
-
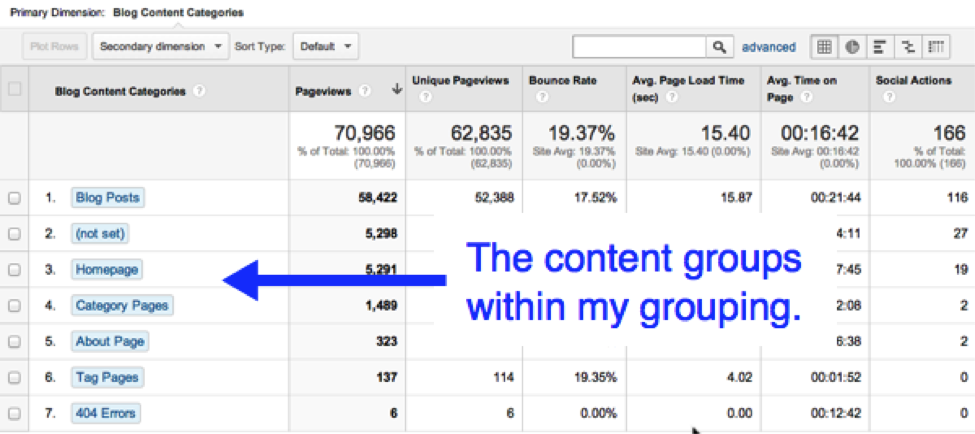
Content Groupings.
This feature allows you to compare metrics by groups that you create. For example, if you wanted to compare the performance of different content, you could group all of your different types of content and then narrow down the groups by URL, page title, etc. In other words, you can compare one group to another or compare different features within one group. It’s all about organization here.
There are three different ways that you can group your pages: Group by Tracking Code, Group by Extraction, or Group by Rules you Create. This can get a little bit complicated, so I recommend checking out this article for more information. Below is a screenshot from cutroni.com:
How to use the feature for SEO: While being able to compare content (or even create a group to compare authors) and create the best content possible is obviously great for your SEO, if you get creative with this feature you will find a lot more benefits. For example, create groups for your top-level navigation to make sure that users (and the Google bots) are able to navigate easily (a huge SEO factor).
How to find this feature: Click Admin on your Analytics page and then click Content Grouping. Click Create New Content Grouping, enter a name for your group, and select your method.
Visit this article from Econsultancy for an entire list of even more custom reports you can run.
Stay tuned for our Part III tomorrow discussing Universal Analytics. In the meantime, if you know of any great Google Analytics features and reports to help improve your SEO (and there are lots!), let us know in the comment section below.